
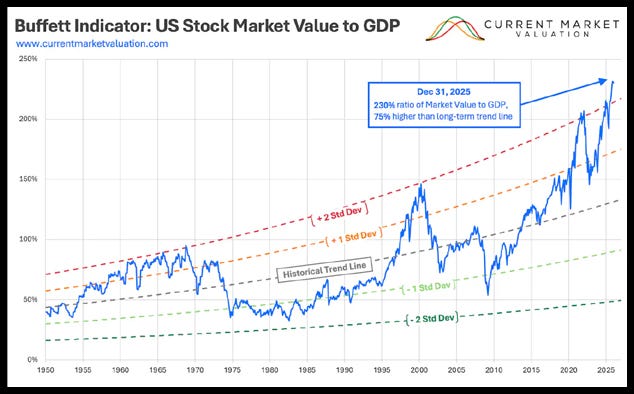
Buffett Indicator
It’s All About Relative Values

Every investor should study the basics of finance. If they have spare funds, there are many options for where they should park them. Without basic understandings of relative values, they don’t have a clue about where the risks are high or low.
Warren Buffet, the famous chairman and former CEO of Berkshire Hathaway, built great value over time by following the basic rules of investing. One of his most famous indicators is named after him; it’s the “Buffett Indicator.” It’s a straightforward measure for determining relative values. It’s simply a graph of the sum value of the total United States stock market laid over the Gross Domestic Product (GNP). The lead-in image of the Buffett Indicator is from the currentmarketvaluation.com website.
Look it over. It’s currently at the top of a range that goes back 75 years. It’s so much higher, which if it were to decline to the Historical Trend Line, stock prices would drop in half! If stocks dropped back to the valuations in 1982 they would drop 89%.
The currentmarketvaluation.com website concludes that the current Buffett Indicator value of 230% is 2.4 standard deviations above the trend line, indicating the market is Strongly Overvalued. If you look closely, this extreme has only been equaled twice in the past 80 years. The first occurred during the explosion of growth during the 1960s. Then again in 2000. Both of those peaks were followed by major market crashes.
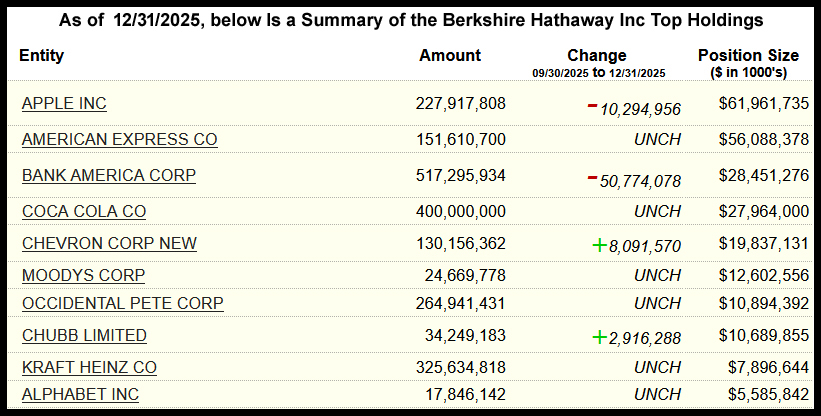
How is Berkshire Hathaway approaching the market these days? It has become far more conservative than in decades. It now holds cash equal to almost 30% of all its assets and continues to increase that holding.
It’s not realistic for a huge investment company like Berkshire Hathaway to move into a 100% cash position. If it held nothing but cash, shareholders looking for growth would sell out. So large companies like that have to be careful how they approach their portfolios. As you can see, its holdings are a cross section of American industry.
This is why individual investors must look after their own investments rather than rely on large intuitions and advisors to do it for them. Smaller investors are far more flexible. They can move into 100% cash positions and put the funds to work in six-month Treasury Bills. They can go short and in a sense “bet against the house.”
Despite the eight weeks of declines, pockets of strength remain. Technical data shows that 15 S&P 500 constituents currently carry relative strength index readings above 70, signaling overbought conditions. The divergence highlights selective resilience in certain stocks even as overall market sentiment remains subdued.
Outlined below are the 15 most overbought S&P 500 stocks according to the RSI indicator:
APA Corporation (APA), RSI of 81.73.
EOG Resources (EOG), RSI of 76.54.
Chevron Corporation (CVX), RSI of 75.96.
LyondellBasell Industries (LYB), RSI of 75.22.
Phillips 66 (PSX), RSI of 74.72.
ConocoPhillips (COP), RSI of 73.93.
Valero Energy (VLO), RSI of 73.68.
Occidental Petroleum (OXY), RSI of 73.38.
Marathon Petroleum (MPC), RSI of 73.23.
Devon Energy (DVN), RSI of 73.19.
Ciena Corporation (CIEN), RSI of 72.76.
Diamondback Energy (FANG), RSI of 72.16.
Coterra Energy (CTRA), RSI of 71.45.
EQT Corporation (EQT), RSI of 71.32.
Dow Inc. (DOW), RSI of 70.73.
The major stock price indexes have been sliding down for eight weeks. So far declines have been very orderly, only to be punctuated with brief rallies. This kind of action hasn’t caused any panic—just anxiety. But economic fundamentals such as liquidity, debts, slow business and employment growth, persistent inflation, and rising interest rates, and now the war on Iran, are acting as a drag that is similar to the bloated debt structure of 2007 that led to a severe recession in 2008.
You can ignore the warning signs and go with the flow. But eventually the debt crisis will hit and the consequences will be rather horrific in financial sense.
Because of soaring debts, America with its overinflated values for assets that can’t support the debt, is a very weak country. Unfortunately, our president doesn’t see it that way and is using debt and more debt to create prosperity. The catch is, the instant debt is created interest is charged. Yet it often takes years for businesses to expand to earn the money to pay that interest. This is how interest can eat a country’s lunch. And, unfortunately, interest rates are in an uptrend that suggests they are going higher!
Since the start of Trump’s second term, the Federal debt has grown from $36.218 trillion to $39.016 trillion as of March 17, 2026. That’s an increase of $2.798 trillion in 14 months and it’s rising steadily. Each new dollar of debt ratchets up the total interest expense that is already the third-largest expenditure after Social Security and Medicare.
Following the drop in stock prices during early March, there may be a dead cat bounce. That is how bear markets keep investors hoping for better days ahead. Huge investment firms use these bear market bounces to sell their more vulnerable holdings in order to increase cash positions. I’m sure that’s what Berkshire Hathaway will continue to do. Better values will eventually come, but it takes time. In my view, as individuals we should play the conservative game in these highly leveraged times.
The Buffett Indicator from Current Market Valuation